Compare some free web analytics and migrate from Piwik Pro to Umami
For several years this site used Piwik Pro for web analytics. The service had a convenient free plan, privacy‑friendly defaults, and a simple integration. Perfect for my low traffic website. However, the free plan has recently been discontinued, and the remaining offers are not suitable for a small personal & free blog like my website. So this forced a migration to another analytics solution.
Compare solutions
My needs are very basic:
- free for a low traffic website
- privacy‑friendly analytics (GDPR-compliant)
- lightweight script
- easy integration with my Jekyll static website
- an API allowing to access data and reuse metrics in other tools (for instance in an Home Assistant dashboard)
Several alternatives were evaluated during a few weeks to compare some results:
- Umami has a cloud-hosted free plan for low traffic and also an open source version that you can self-host for free
- GoatCounter is also free for low traffic, and the origin of this tool is exactly what I am looking for
- As I am using Cloudflare as CDN, I have also tested the free Cloudflare Web Analytics ; there is also a GraphQL API, but I discovered a bit late that it was exluded from the free plan
Main collection techniques and major issues
Web analytics has become quite complex:
- Website logs: some years ago, the easiest way to get data was from access logs from the web server ; you were certain at that time to get all the requests, but this method have now several problems: Content Delivery Network will cache and serve contents without soliciting your own web server, so you will miss a good part of your traffic ; also, I am using GitHub Pages, and GitHub does not make available the server logs, also you won’t be able to differentiate users/sessions. This method is fairly limited and no more usable
- JavaScript snippet to collect data: the most common one, you include a small JavaScript snippet that will run on your page, in the browser of the user, and it will call an API to record usages ; this can record a lot of information, including personal information ; the choice of the solution you use is very important to record only the information you need, in my case without personal information, and without the need of cookies ; the drawback of this method is that it depends on the user browser settings regarding JavaScript, or ad-blockers browser extension that may filter those snippets out
- pixel images are 1-pixel transparent image, that will trigger the record of the usage ; you can pass some basic information with the query parameters of the image ; as this is included as an image, it is less likely to be deactivated by the browser or extensions, but you will usually get less information
Also, there are now a lot of crawlers and search engines to be known to filter out crawlers from usage, and find the relevant source of traffic.
I have activated both JavaScript snippet and pixel image for Umami and Goatcounter to be able to compare the difference between all the methods.
Test Dashboard Comparison
Due to the short notice of Piwik Pro end of free plan, I have only tested the different methods on a week, but still we can see some interesting elements. The following dashboards show the collected metrics during the evaluation period.
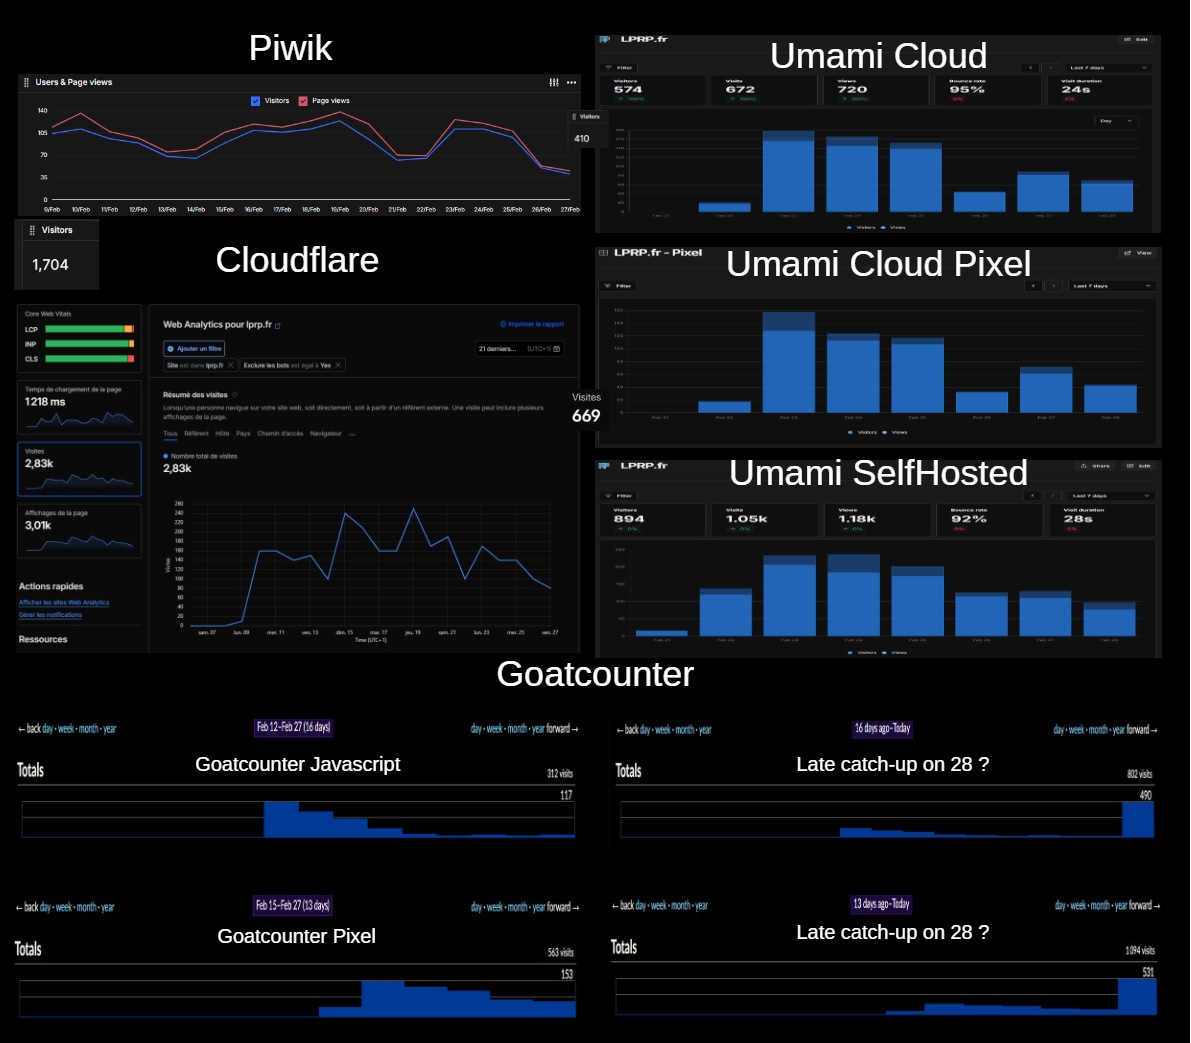
From those dashboards we can see:
- we have large differences between all the results!
- Goatcounter is clearly having some troubles recording the usages, quite consistently for JavaScript snippet or pixel image ; it seems that the totals are correct, but maybe some collected usages were treated lately at the time of the test ; remember this is a non-professional solution and is totally free, so anyway, it is very good for what you pay
- Umami Cloud and Cloudflare display quite comparable information, with the same curve as Piwik, but counts more users than Piwik
- Umami Self-hosted is counting more visits, and with a curve looking a bit different ; this can be explained in different ways: the script and URL is unknown from adblockers and do not get blocked, or the self-hosted version is less accurate in crawlers filtering
- anyway, do not expect exact values from any web analytics engine, but use it as rough estimates and trends
Final Choice: Umami Cloud
After testing the different solutions, I decided to go mainly with Umami Cloud. Main reasons are simple setup, privacy-friendly, lightweight, clean dashboard with everything that I need, good API, no infrastructure to maintain, and all that for free for my low traffic website. That was also the solution with the most consistent numbers in the test period. I think I will keep the other solution for some time to see webstats differences in a longer period, and also in the case Umami Cloud have in the future the same bad idea than Piwik of removing the free plan.
The migration part
Jekyll data collection
I included in my Jekyll build the required files and lines for data collection
    {% when 'umami' %}
        <!-- Umami cloud or self-hosted https://github.com/umami-software/umami -->
        {% if analytic[env].token %}
            <script defer src="{{ analytic.script |default: 'https://cloud.umami.is/script.js' }}"
                    data-website-id="{{ analytic[env].token }}"
                    {% if analytic.host %}data-host-url="{{ analytic.host }}"{% endif %}
                    data-tag="page_{{ include.lang }}"></script>
        {% endif %}
        {% if analytic[env].noscript-pixel %}
            <noscript>
            <img src="{{ analytic[env].noscript-pixel }}" loading="lazy" style="position: absolute; top: 0; right: 0; width: 4px;">
            </noscript>
        {% endif %}
        {% if analytic[env].pixel %}
            <img src="{{ analytic[env].pixel }}" loading="lazy" style="position: absolute; top: 0; right: 0; width: 4px;">
        {% endif %}
Full script for all services on my GitHub
Jekyll use of Umami results
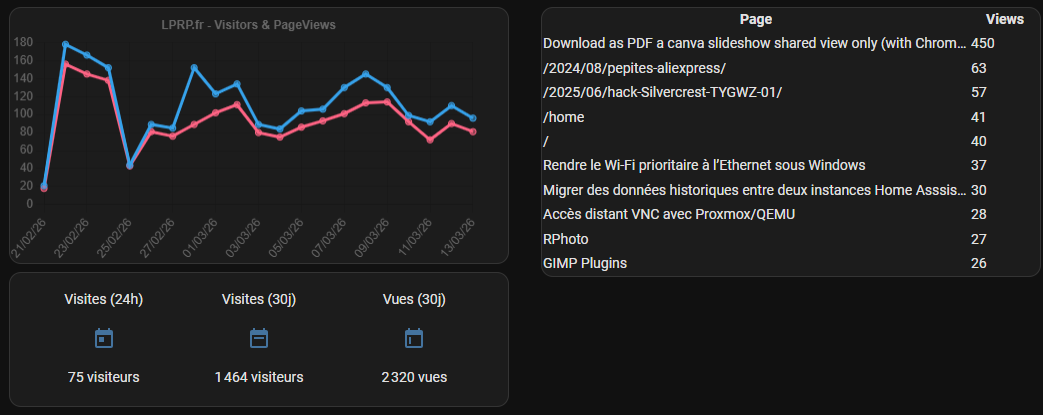
I use top pages on the front page to display most viewed pages in the corresponding order, and in the blog view to display top ten. To make the data available, here is what I am using:
- I have created a share URL for my Umami ; this enables to share a readonly view of all the data ; this URL gives a readonly UI on your data, and also enables to get a read-only token and use the allowed API with that token
- This URL can be shared as is, as it is readonly, but I added another layer to avoid making available the full data ; a script is run weekly as action workflow on my github repository, run a script that authenticate to Umami share URL (given as github “secret”), and save the result in a gist.
- The URL of the corresponding GIST in included in my jekyll website, and a javascript code fetchs the gist to display the posts or widget, the corresponding code is:
A dashboard in Home Assistant with Umami web stats
I also have created a dashboard in my Home Assistant to integrate directly Umami visitors graphs and top pages. I have a dedicated GitHub repository rpeyron/homeassistant_umami with all the elements and a usage guide.
This ends the last feature I wanted with my new Umami web analytics.
Annexes
Cloudflare GraphQL Explorer for Web Analytics
One last thing about Cloudflare, the GraphQL API is not available with the free plan, but you still can use the Cloudflare GraphQL Explorer to query your data (and see what you could get with the paid plan). Anyway, this is a good solution to be able to manually query your data.
You first have to login to the {Cloudflare GraphQL Explorer](https://graphql.cloudflare.com/explorer)
You will need to configure the identifiers you will use: {"accountTag":"<your account id>","siteTag":"<your site id>","dateFrom":"2026-02-01T00:00:00Z"}
And then use the following GraphQL to get visitors number:
query($accountTag: string!, $siteTag: string!, $dateFrom: Time!) {
        viewer {
          accounts(filter: {accountTag: $accountTag}) {
            rumPageloadEventsAdaptiveGroups(
              filter: {
                datetime_geq: $dateFrom
                siteTag: $siteTag
              }
              limit: 31
              orderBy: [date_ASC]
            ) {
              dimensions {
                date
              }
              sum {
                visits
              }
            }
          }
        }
      }


Top viewed posts in Jekyll with Piwik
Static site generators are cool to make simple, efficient and easy to host websites, but obviously not able to realize dynamic features. As it cannot be implemented server-side, the only way to implement such feature is to do it browser-side with some JavaScript.
Multi-language Jekyll
In the migration process of my website from WordPress to Jekyll, I had to deak with some multilanguage. I usually write in english what is susceptible to interest a large worldwide audience (like some article on jekyll), in french what is mainly targetted on french users or topics already widely...

Migrate WordPress comments to Giscus
In this post about my migration process to Jekyll I explained the reasons that made me choose Giscus as commenting system. But unfortunately it does not come with a tool to migrate comments to GitHub. So I tried to make one.

View your website locally without environment
You may want for some reasons to see your website outside its deployment environment, for instance to see an older version. There are full-featured WAMP/LAMP servers with all the tools needed, and I used for my WordPress years the great MicroApache that bundle Apache+PHP+SQLite in less than 1 Mb. But...